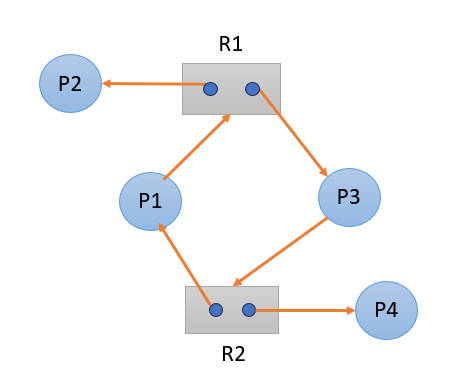
Example 1: Deadlock Diagram
In the diagram, resources R1, R2, and R3 are held by one process each.
P1 holds R1 and waits for R2.
P2 holds R2 and waits for R3.
P3 holds R3 and waits for R1.
Resources can only be released by the process holding them; they can't be taken away by force.
There is a circular chain: P1 → P2 → P3 → P1.
Since all four conditions (Mutual Exclusion, Hold and Wait, No Preemption, and Circular Wait) are present, the graph indicates a deadlock.
Example 2: Non-Deadlock Diagram
In the diagram, resources R1 and R2 are each held by one process, satisfying the mutual exclusion condition.
P1 holds R1 and waits for R2.
P2 and P3 are only connected to R1.
P4 is only connected to R2.
The hold and wait condition isn't fully met, as P2 and P4 aren't waiting for other resources.
The no preemption condition is satisfied because resources can only be released by the process holding them and cannot be forcibly taken.
Only P1 and P3 form a circular wait, while P2 and P4 do not, so a full circular condition isn’t maintained.
Since not all deadlock conditions are met, this is not a deadlock graph.